Going into the MLB All-Star Break, the Boston Red Sox have a respectable 53–42 record, good for third in the AL East. However, their 24–25 record at home is surprisingly poor. I had to investigate what could cause that. Spoiler: I’m left with more questions than answers.
Baseball is unique in that home-field advantage exists not only from the energy brought by fans or the comfortable routine that a team gets from staying at home instead of a hotel. The fields are quirky; ideally, the home team understands their field enough to play it well compared to the visitors. Fenway is among the weirdest ballparks out there.
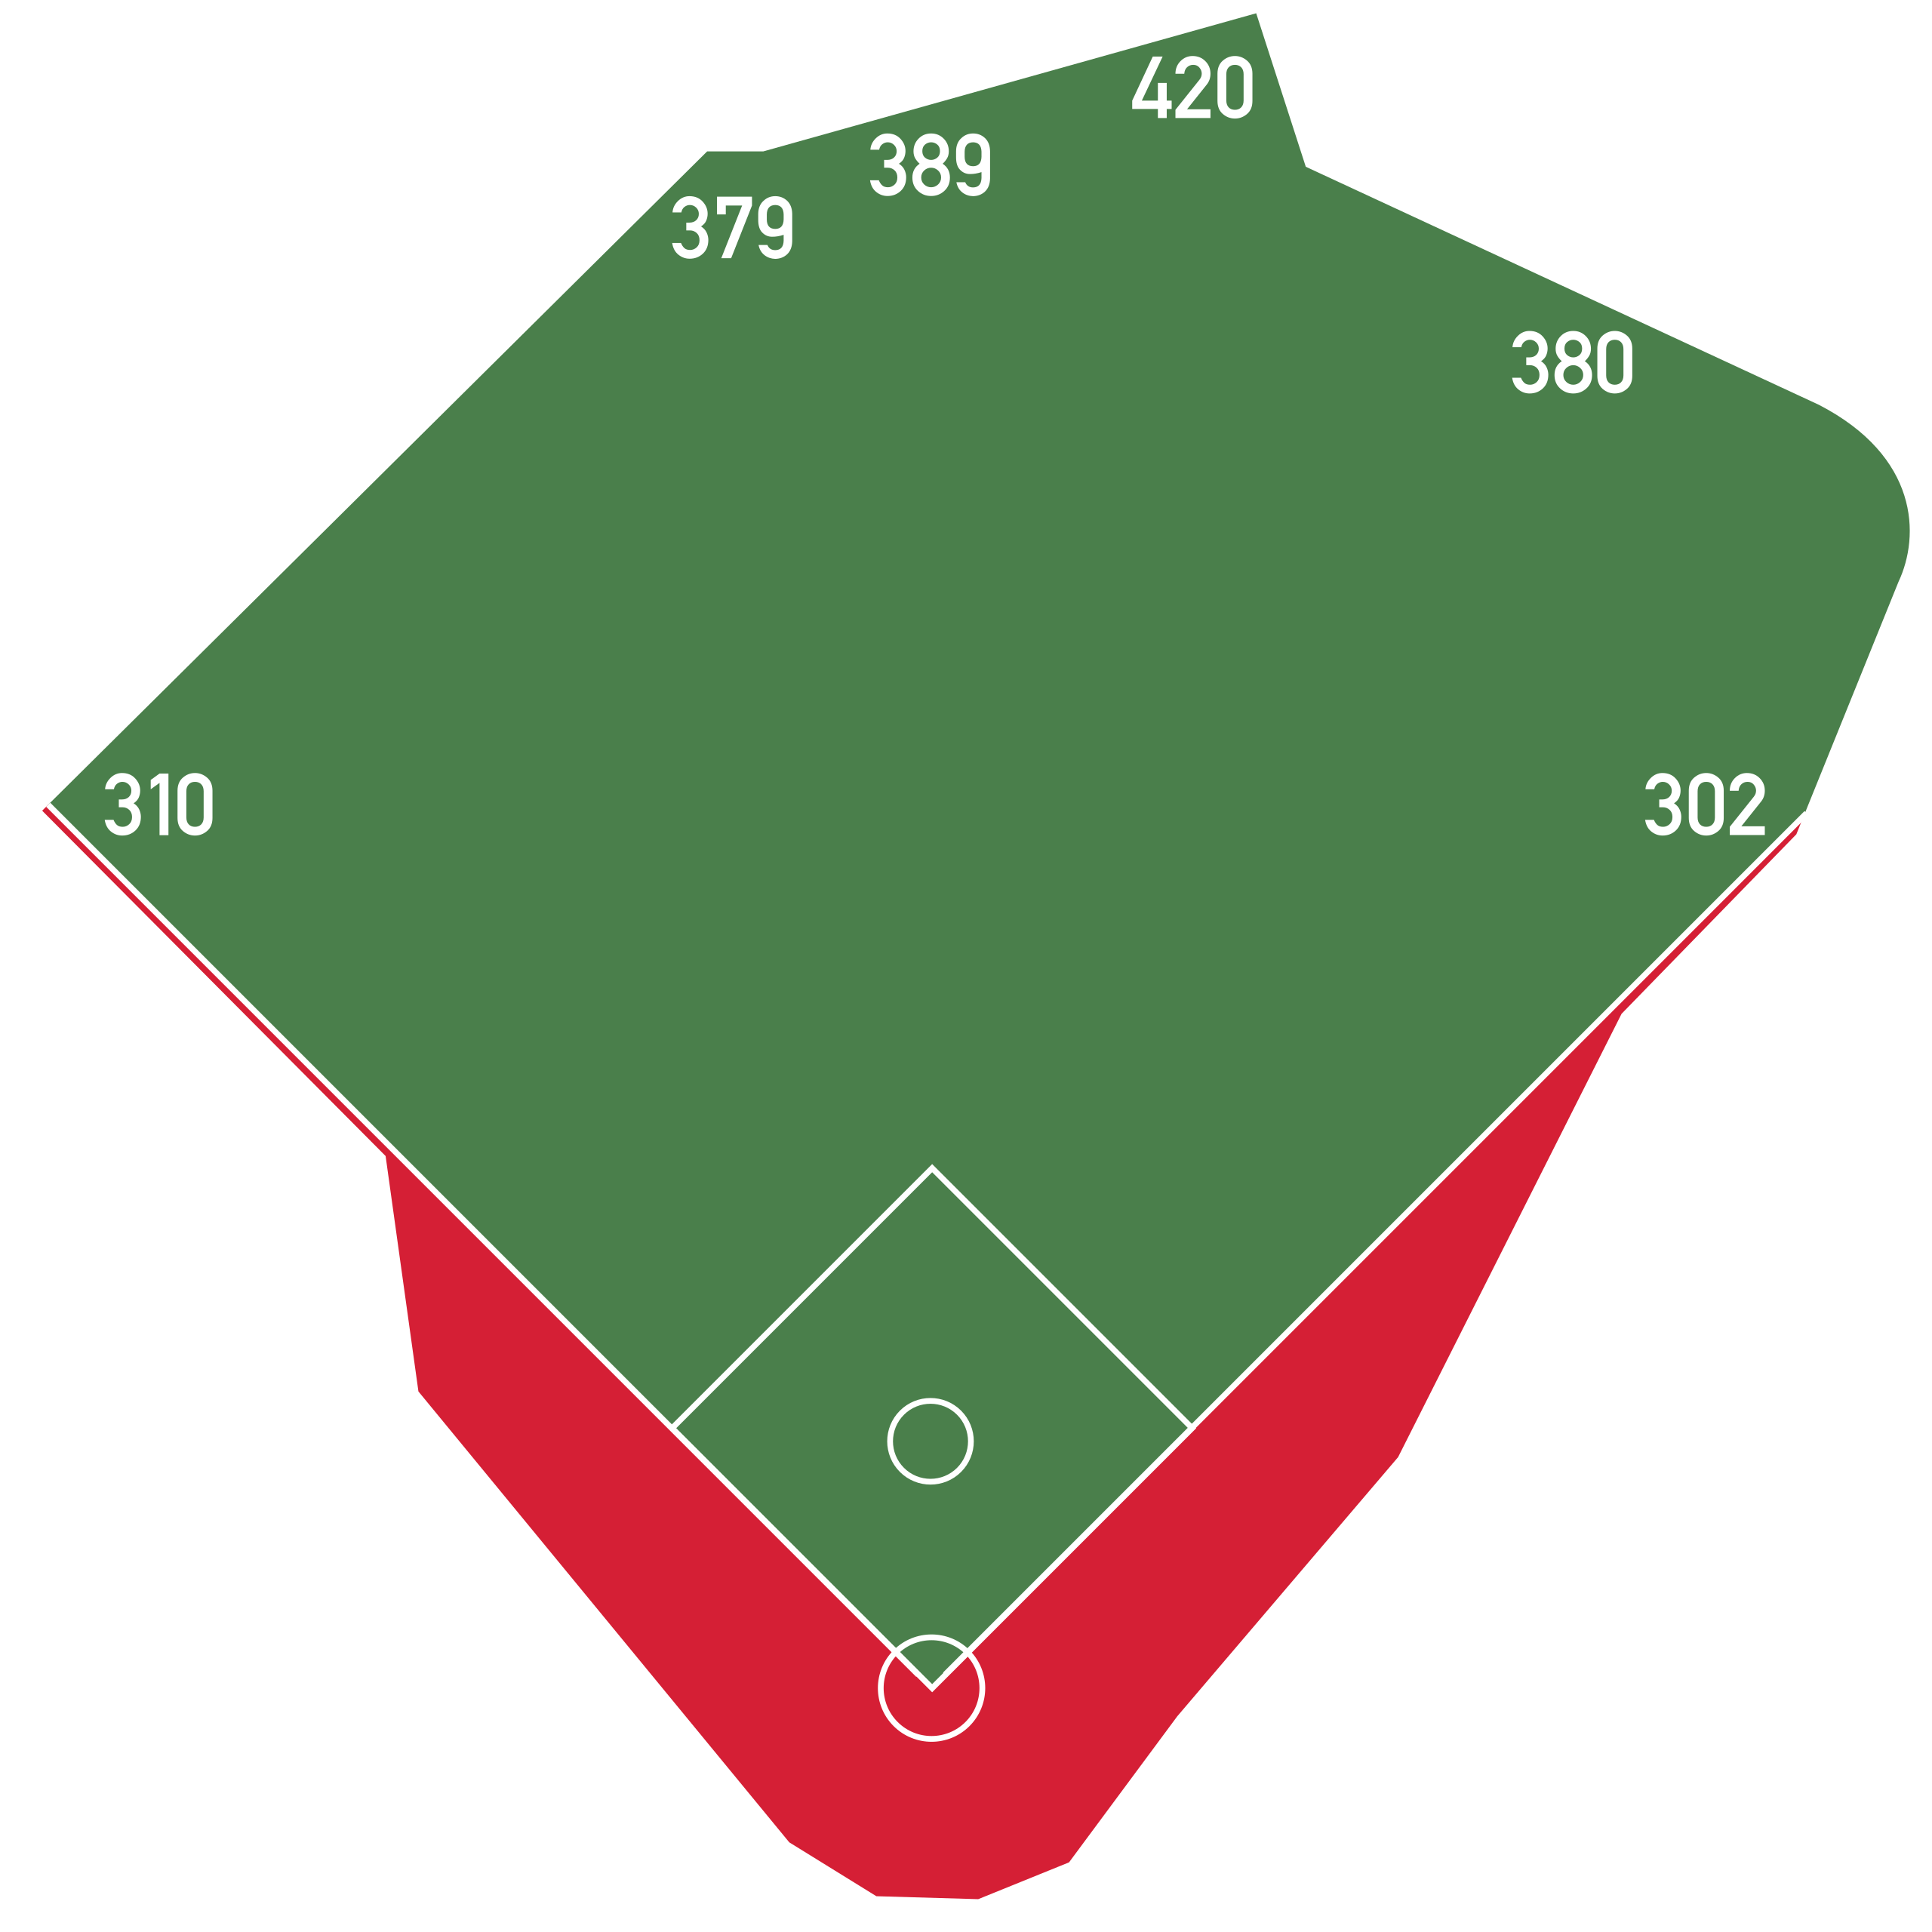
You have the Green Monster in left field, odd nooks and crannies in center, and the short fence in right curves into Pesky’s Pole. Misplays are common and hilarious. My first guess was that the Red Sox built a team incapable of playing well on their own field. They have scored 0.6 fewer runs at home than on the road (4.4 vs. 5) and allowed a full 1 run more per game at home than on the road (4.7 vs. 3.7).
Given that the disparity in runs allowed is greater, I’ve focused on that. I considered their fielding: What if their outfielders aren’t equipped to play their home turf? While not a perfect way to look at this, I checked out how often they allow runners on base due to errors at home versus on the road. It happened 27 times at home and 14 times on the road.
| Runs | WPA | RE24 | |
|---|---|---|---|
| Home | 7 | -1.63 | -15.9 |
| Away | 5 | -1.07 | -8.15 |
| Total | 12 | -2.7 | -24.05 |
We can see they gave up 7 runs on these plays at home for a net impact of about 1.5 wins1 against them. While worse than the 5 runs and about 1 win deficit they’ve experienced on the road, this clearly isn’t the reason. The effect per error is lower at home since they allowed such runners nearly twice as often but did not experience double the impact.
I went broader in my exploration and started investigating their overall pitching results at home and on the road, split by whether runners were on base. I’m baffled by what I see because I can’t imagine what could be causing it.
Let’s focus on some key stats2 that illustrate the Red Sox’s struggles at home with runners on base. For all three of these statistics, a larger number is worse for the Red Sox pitchers.
| OPS | FIP | BABIP | |
|---|---|---|---|
| Home, No Runners | .597 | 3.24 | .264 |
| Away, No Runners | .666 | 3.59 | .287 |
| Home, Runners On | .786 | 4.22 | .322 |
| Away, Runners On | .650 | .398 | .268 |
When the Red Sox are on the road, their pitchers are slightly worse with nobody on base. Then, by some metrics, they lock it down and perform better once the runners are on. The same cannot be said about their work at home. While they’re slightly more effective at stopping runners from getting on in the first place, once runners get on base everything falls apart. Batters are finding places to hit the ball where fielders aren’t getting them. Opposing hitters look like sluggers across the board.3
So here are several symptoms without an apparent cause. The increase in BABIP still suggests that Fenway has something to do with it. This is also backed by the fact that their FIP, which removes the effect of defense, is not as dramatically worse at home than away. But there is still a difference in FIP, so it’s apparent that pitchers are doing worse at home in these situations, regardless.
This will stick in my brain, but I needed to get my thoughts out first. I hope to find something more later this year, but right now, I’d be prepared for a frustrating experience when visiting Fenway after watching the Red Sox perform on the road.
WPA stands for “Win Probability Added.” A WPA of 1.00 means that a team has increased their probability of winning a total of 1 win’s worth. This is based on comparing the previous state of the game to the state after a play occurs. ↩︎
For those of you not into hip new stats: OPS is a rough measure of total offensive production by a hitter. FIP is meant to approximate how well a pitcher is doing by excluding how their defense affects the results of play. BABIP is a hitter’s batting average on balls they hit into fair territory. All this data is pulled from FanGraphs. ↩︎
Average BABIP is always around 0.300; the league’s average OPS in 2024 is 0.709. ↩︎